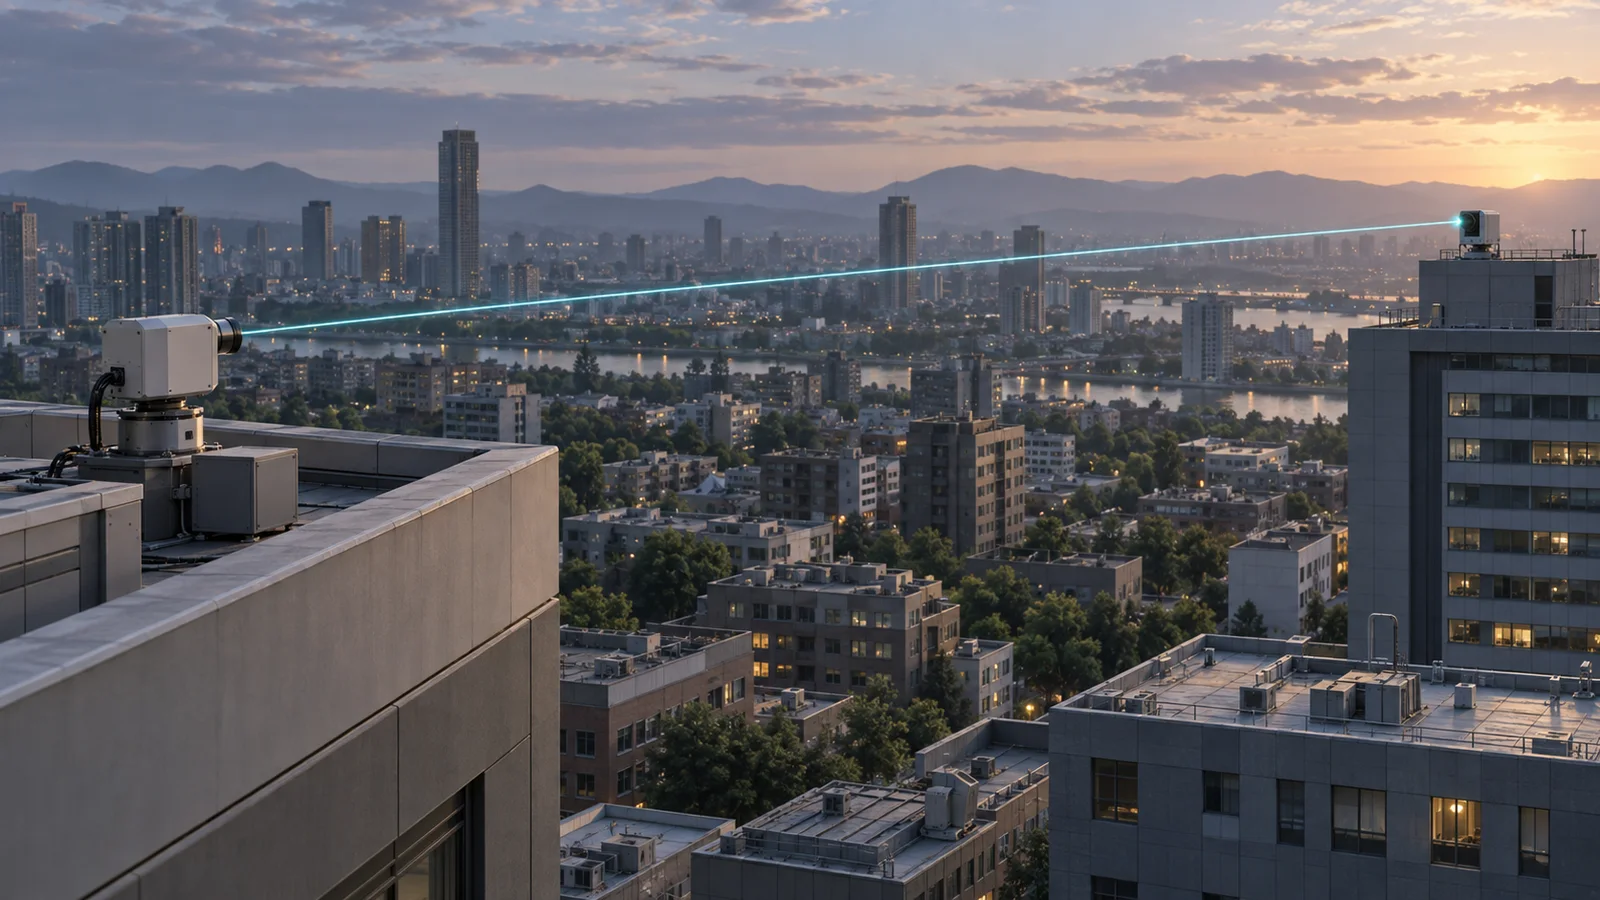
Airborne and fixed-receiver tests, with the measurements and configuration of each result shown below. The fixed-receiver distance is not an airborne operating-range specification.
Power-beaming demonstrations
Airborne power-link concept
40m
40 m drone demonstration
Power delivery to a drone over a 40 m link, with 20 W electrical output and a 15 g optical receiver.
Electrical output
20 W
At the receiver
Laser source
100 W
Optical power
Wavelength
808 nm
Conversion efficiency
20%
Light-to-electricity
Receiver mass
15 g
Experiment range
40–100 m
Drone mass
150 g
Drone size
30 cm
The trial combined in-flight power delivery with continuous aircraft tracking on a lightweight multirotor.
The linked flight demonstration is 40 m; 40–100 m is the reported experiment range. Conversion efficiency is light-to-electricity, not total DC-to-DC efficiency.
A 1.5 km roof-to-roof link with a stationary receiver, studied across varied weather conditions.
Receiver
Stationary
Wavelength
1064 nm
Experiment programme
3,000+ h
Cumulative experimental work
Conversion efficiency
Up to 15%
Light-to-electricity
Conditions
Varied weather
Pointing
Precision trials
Feedback
Receiver communication loop
Configuration
Roof to roof
The programme evaluated precision pointing and the receiver communication loop on a fixed optical link across changing weather conditions.
3,000+ hours describes the cumulative experiment programme, not a single uninterrupted power-delivery run. The reported peak efficiency is light-to-electricity, not total DC-to-DC efficiency.
Research observations
Inside the optical link
The technical presentation describes a separate 1064 nm urban-path research series, examining how the received beam profile interacts with the receiver and its electronics.
The beam profile changes
Successive received-beam images show an uneven light distribution with shifting bright regions. That redistribution can create different currents across photovoltaic cells, even when the beam remains on the receiver.
Receiver electronics matter
Uneven illumination can destabilise maximum power point tracking (MPPT). The research considers collecting light over a larger aperture, separate MPPT for receiver segments, and capacitors to buffer short-term fluctuations.
Correct position, size and shape
The research architecture focuses on the beam centre, spot size and ellipticity — how elongated the spot is. These properties can be addressed with steering and focus adjustments, without attempting full-wavefront correction.
Use the receiver as a sensor
Currents measured from individual receiver groups can provide a coarse map of the arriving light. The presentation explores this as a feedback signal alongside camera-based and dedicated optical sensing.
These are research observations and design approaches from the technical presentation, separate from the two reported demonstrations above. They are not specifications for delivered power, efficiency or operating availability.
Evaluate the link for your setup.
Share the aircraft or receiver, electrical demand, distance and operating environment. We will identify the integration work and measurements needed for a useful evaluation.